> ## Documentation Index
> Fetch the complete documentation index at: https://seal-d2ca5bea.mintlify.site/llms.txt
> Use this file to discover all available pages before exploring further.
# Charts
> Charts are a Type in Seal that enables you to plot and visualise data.
## How do I plot charts?
Charts can be created via the query page, or via automations.
### Via the query page
1. Toggle on relevant filters on the query page to get the entities you would like to plot.
2. Select the Charts icon.
 3. Filter out your charts with the configurations available.
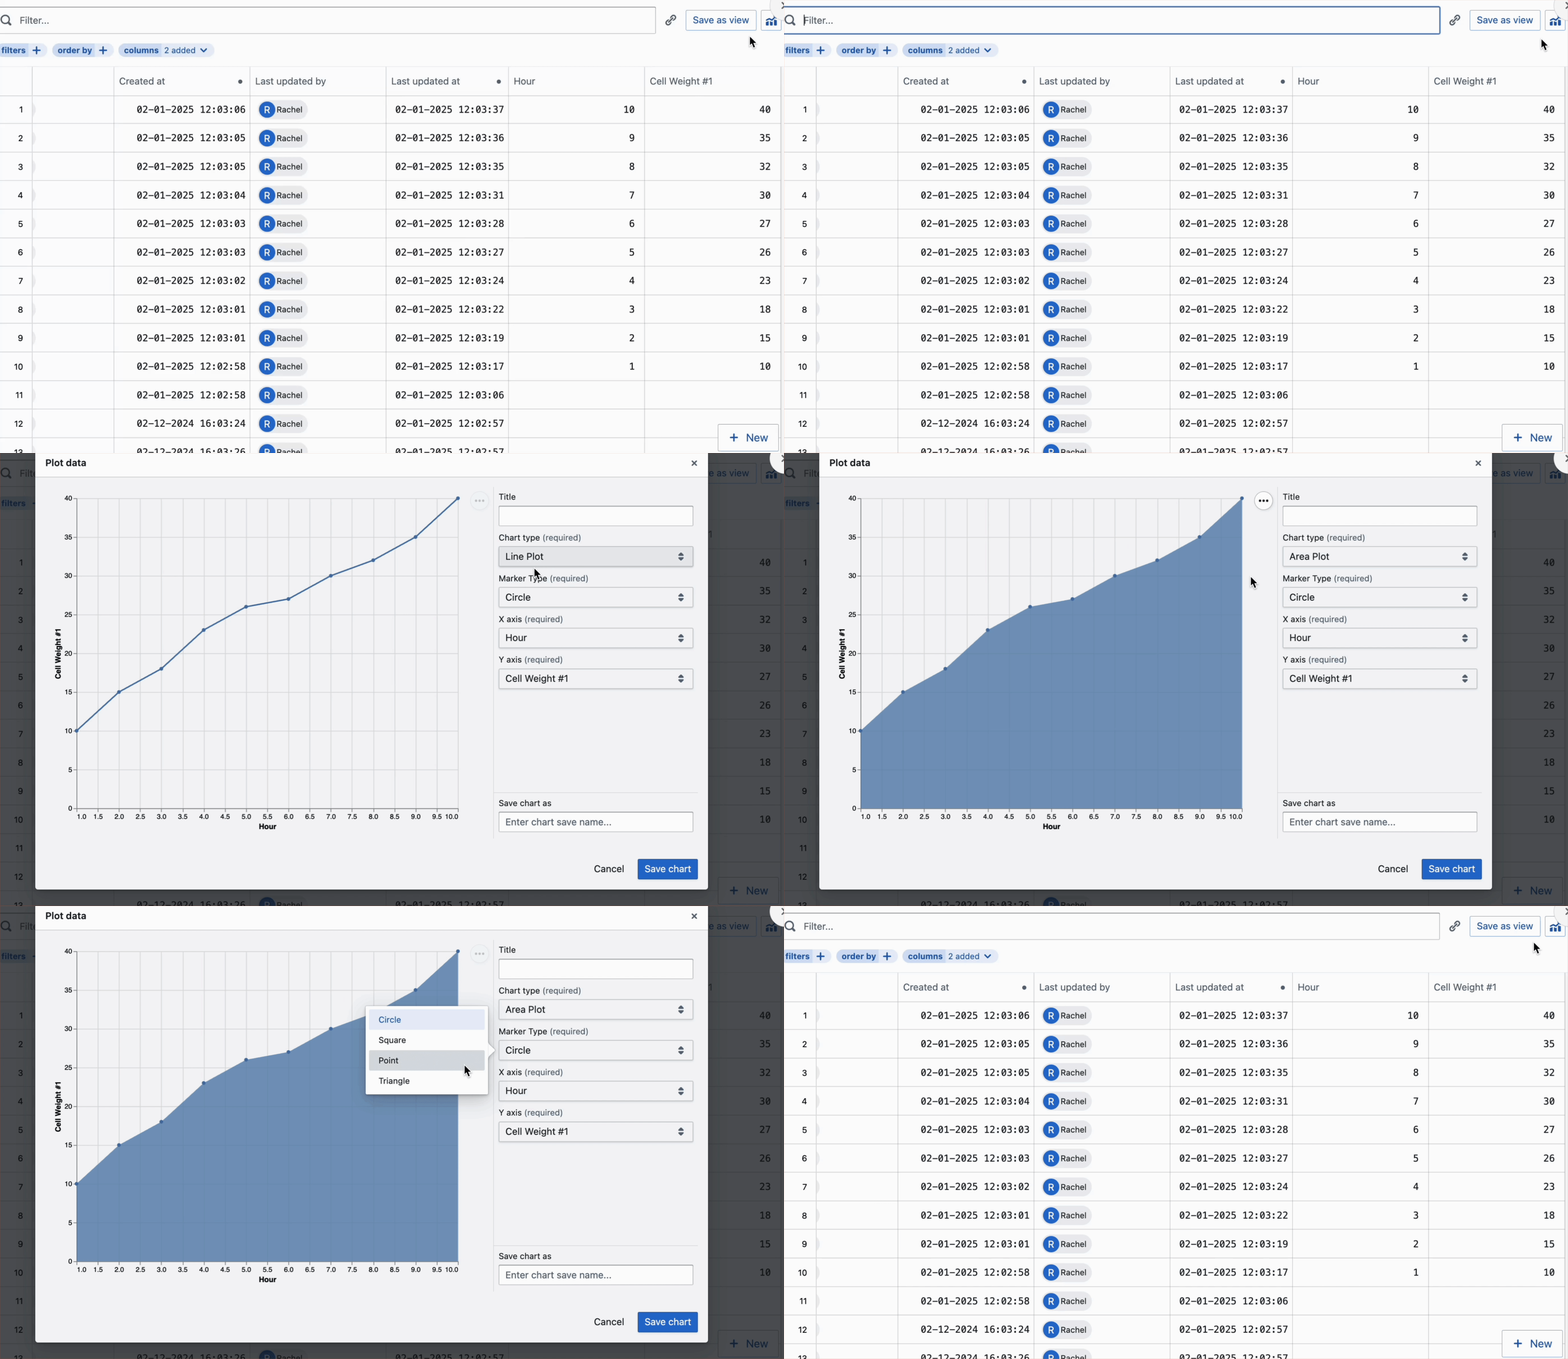 Charts can be saved, exported as images, and can be referenced in documents or procedures.