How do I plot charts?
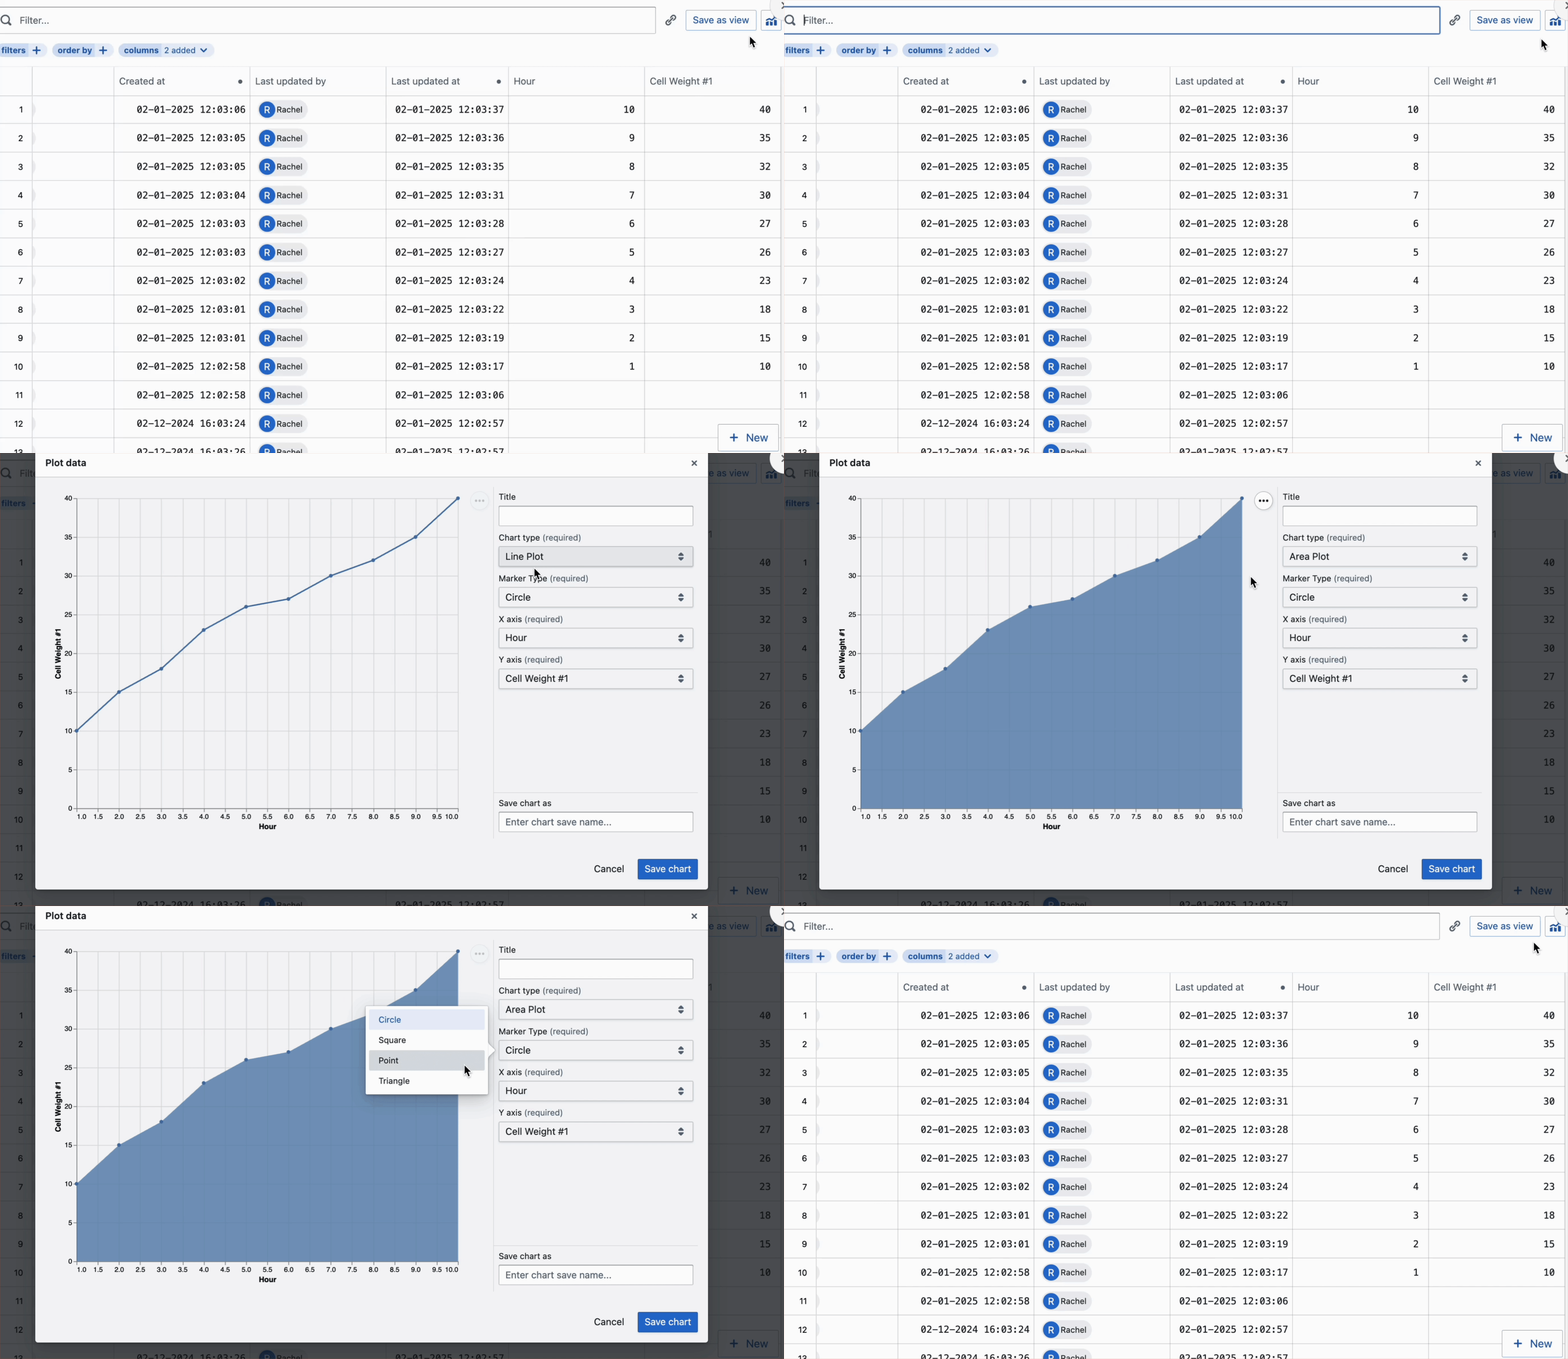
Charts can be created via the query page, or via automations.Via the query page
- Toggle on relevant filters on the query page to get the entities you would like to plot.
- Select the Charts icon.

- Filter out your charts with the configurations available.